Data Analytics MasterClass (PostgreSQL, BI, Python)
PostgreSQL for Beginners, PowerBI MasterClass, QlikView/Qlik Sense Dashboard Design MasterClass, Python for Beginners
Arthur Fong
Summary
- Certificate of completion - Free
- Reed Courses Certificate of Completion - Free
Add to basket or enquire
Overview
Subject Included:
- PostgreSQL for Beginners
- PowerBI MasterClass
- QlikView Dashboard Design MasterClass
- Qlik Sense for Beginners
- Python for Beginners
Curriculum
Course media


Description
Today, we are all surrounded with full of data.
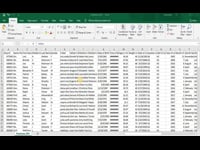
Data can be in the form of structured data(eg: Tables, and worksheets), or unstructured data (free text fields or comments from social media).
An example of Data Usage is in AI model.
Data are the core of an AI model, which utilizes data input for the model to train, test, and learn from the data.
The usage of Machine Learning has allowed computers to perform predictions and provides suggestions to humans based on the data input that has been fed into the machine.
An example of Machine Learning is the Web Search Engine, which tries to understand what is the content we are searching for based on the data input that has been entered into the Search Engine.
This course offers everyone an abundance of information about analytical tools that may help you in developing your career moving forward.
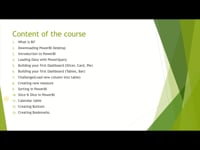
Content in this course is as below:
Database
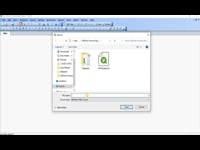
1. PostgreSQL For Beginners
Learning Outcomes:
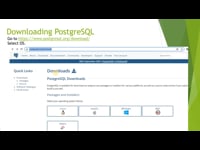
~How to install and configure PostgreSQL.
~How to create and modify tables in PostgreSQL.
~How to perform basic SQL commands in PostgreSQL.
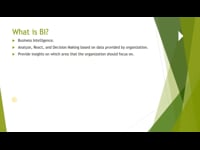
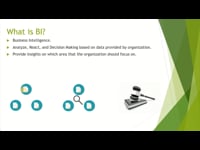
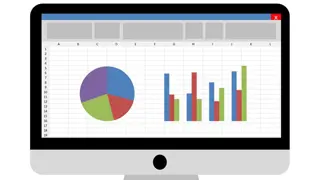
BI (Business Intelligence)
2. PowerBI MasterClass
Learning Outcomes:
~How to transform our columns to extract values or change column formatting
~How to add new columns, eg: Custom columns, conditional columns, index columns, etc.
~DAX expressions
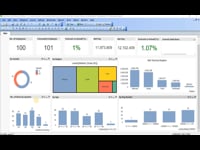
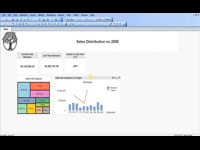
3. QlikView Dashboard Design MasterClass
Learning Outcomes:
How to build a simple dashboard:
~ HR Dashboard
~Opening a Fast Food Restaurant
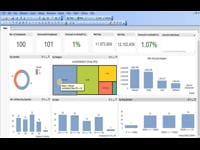
~Sales Dashboard
4. Qlik Sense for Beginners
Imagine if we are recently appointed to be a director of an organization, are we able to:
1. React based on the latest or historical information around us?
2. Reduce or automate the manual work done in decades?
3. Draw insights from a stack of printed reports?
If you do not have the answer, join this class to know more about Qlik Sense which can help solve your problems.
Advanced Analytics
5. Python for Beginners
Learning Outcomes:
1. Python Function and Class Objects.
2. Data Types - String and Numeric.
3. Python Data Structure - List and Data Dictionary.
Who is this course for?
This course is suitable for anyone who is interested in pursuing the following professions:
- BI Analyst
- Business Analyst
- Fresh Graduate in IT
- Database Administrator
- Data Analytics Beginner
- Business Intelligence Beginner
- Python Beginners who are curious about Data Science
Requirements
Suitable for all levels
Career path
This course is suitable for anyone who is interested in pursuing the following professions:
- BI Analyst
- Business Analyst
- Fresh Graduate in IT
- Database Administrator
- Data Analytics Beginner
- Business Intelligence Beginner
- Python Beginners who are curious about Data Science
Questions and answers
Currently there are no Q&As for this course. Be the first to ask a question.
Certificates
Certificate of completion
Digital certificate - Included
Reed Courses Certificate of Completion
Digital certificate - Included
Will be downloadable when all lectures have been completed.
Reviews
Currently there are no reviews for this course. Be the first to leave a review.
Add to basket or enquire
Course provided by
Legal information
This course is advertised on reed.co.uk by the Course Provider, whose terms and conditions apply. Purchases are made directly from the Course Provider, and as such, content and materials are supplied by the Course Provider directly. Reed is acting as agent and not reseller in relation to this course. Reed's only responsibility is to facilitate your payment for the course. It is your responsibility to review and agree to the Course Provider's terms and conditions and satisfy yourself as to the suitability of the course you intend to purchase. Reed will not have any responsibility for the content of the course and/or associated materials.